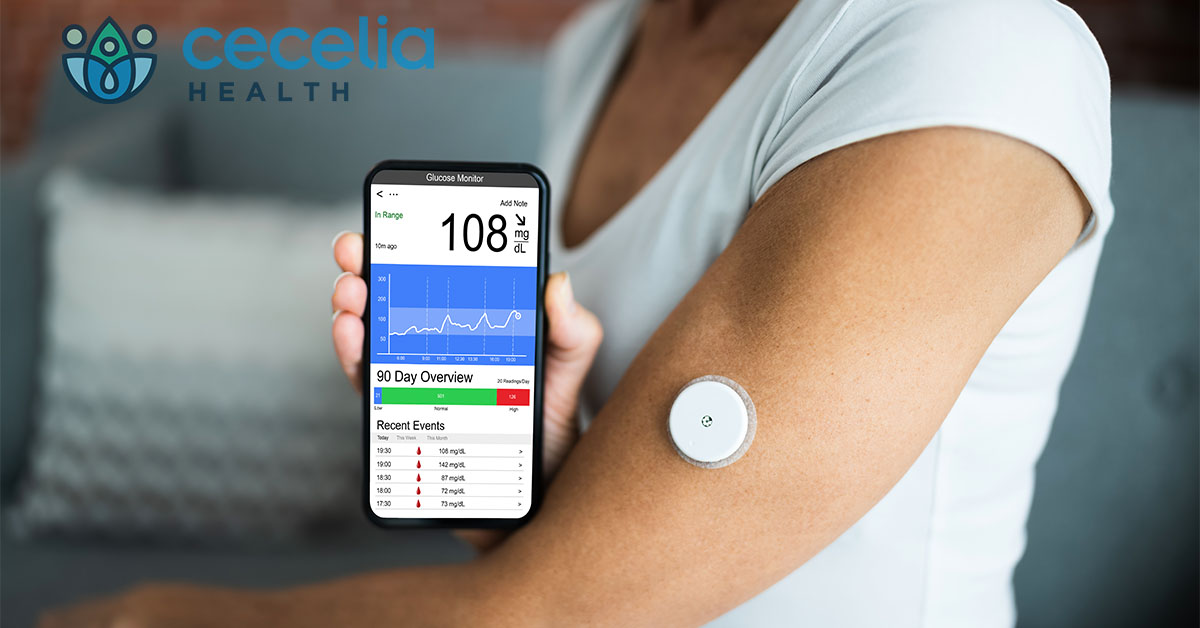
Continuous Glucose Monitoring (CGM) is a game-changer for many people with diabetes. People praise CGM with comments such as “I LOVE this thing!” and “This has changed my life!” These heart-felt emotions arise from having real-time glucose information 24/7 and knowing where the glucose values are going.
People like yourself who wear CGM describe many ways they benefit from real-time information:
- Preventing lows with CGM alarms makes life more peaceful.
- Dosing becomes more precise with trend arrows because you will make a different decision with a pre-meal glucose of 150 trending up compared to a glucose of 150 trending down.
- Getting into the driver’s seat of your car is more comfortable now that you are wearing CGM and don’t have to guess how your glucose is trending.
- You can go to bed without fear of waking with night-sweats because you know your CGM alarm with give you advance notice before a low strikes.
Real-Time CGM data like this is incredibly beneficial. In fact, these are the selling features that have made CGM the superstar that it is.
Retrospective Reports provide insight into your patterns.
Retrospective data is a different kind of CGM data that is also extremely valuable. This data prepares your past glucose information into tables, graphs and reports that allow you to identify and address patterns that may not be obvious from real-time data. Is your physician or diabetes educator (CDCES) the only people viewing your retrospective data? You can take the next step in diabetes self-management by learning how to read your reports and search for insights and trends.
Increase your familiarity with the retrospective reports by viewing them on a weekly basis. There are many pages on each CGM website/app and at first glance they may be overwhelming. However, through regular use, people generally find 2-3 reports that become their favorites. Here are a few typical favorites:
1. Ambulatory Glucose Profile (AGP) Report: This is a standardized overview of the data and allows you to 1) visualize your glucose graph in the “Ambulatory Glucose Profile,” 2) note your average glucose, and 3) detail your percent of “Time in Range” (70-180 mg/dl). Minimizing time spent in the low range is important for comfort and safety. The AGP Report will quantify your time spent in the Low range (54-69 mg/dl) and time spent in the Very Low range (<54 mg/dl).
2. Overlay Report (Dexcom) and Glucose Pattern Insights (LibreView): View these graphs to see all of your days layered on top of each other. This allows patterns to visually appear, or “POP” on the page. You will see where you most often drop low or where you typically soar high during the day. The Dexcom Trends report is another aggregate graph that uses color to show time above the high threshold and below the low threshold.
3. Daily Report or Daily Log: View the individual days in retrospect to notice any differences between weekdays and weekends, or exercise days and rest days. Find your very best days and celebrate your success while reflecting on what behaviors and activities have worked well.
Prioritize your treatment goals.
Once you have observed all of your patterns, it is important to prioritize your treatment goals. Experts suggest you start with treating hypoglycemia first.
1. Look for patterns of LOWS. What time of day are you most likely to drop low, or what activity is most associated with lows? Here’s what you are looking for: if the low is happening overnight or between meals – this could be an issue with your basal rate. If the low is following a meal – this could be the result of a miss-match between your bolus and your carbohydrates. If the low is associated with an activity – this could require a temporary basal rate or a well-timed snack. Take these observations to your provider and discuss possible solutions and treatment decisions.
2. Look for patterns of HIGHS. What time of day are you most likely to peak above 180 mg/dl? The time of day will often give insight to the cause. If the peaks are usually after dinner – you have several options: change the dinner dose, bolus earlier, or change your food choices. If the peaks are associated with night-time snacking – you may need to cover the carbs or change your snack choice. If the peaks are in the morning – this may indicate the need to adjust basal rate. Talk to your provider about these patterns because there are many options to help you avoid the highs.
Where do you find your retrospective data?
People who use smart phones to read their CGM can simply visit the device website or app. People who use a dedicated CGM receiver will need to upload the receiver to the manufacture’s website to view the reports.
- Dexcom: clarity.dexcom.com.
- Freestyle Libre: LibreView.com
- Medtronic Guardian: carelink.minimed.com
Conclusion
Your glucose patterns reveal the keys to future success. While wearing your CGM, all of your data is automatically being collected and organized into reports. This valuable information is at your disposal to help you better understand your level of diabetes control, your areas of strength, and your opportunities for improvement. While we know you love the CGM Real-Time data, learn to use the CGM Retrospective Reports to bring you to the next level of diabetes control.
For more information on the AGP Report visit DiaTribe:
