Continuous glucose monitors (CGM) are an on demand, continuous check on glucose levels every few minutes, 24-hours a day. This allows the user to see glucose levels in real time and set alerts before blood sugar gets too high or low, so it can easily be corrected before it becomes critical or dangerous. Additionally, CGM data can be shared with others, allowing for additional support and an extra pair of eyes, to help monitor the individual living with diabetes, ensuring they remain safe. Beyond telling the user what their glucose levels are, a CGM also provides invaluable data that can be used to determine if insulin is being used appropriately as part of overall blood sugar management. CGMs have become more widely available, but its successful utilization remains low, many people simply do not understand how to interpret the data. This article will hopefully clarify the individual data points on a CGM and explain how to better use this information to obtain optimal glucose control.
Alerts
CGM glycemic targets and alerts can be customized to meet the needs of each individual living with diabetes and this tool is very useful. The ADA recommends that as a baseline, a healthy range for alerts should be no lower than low at 65mg/dL and high, no higher than 180mg/dL. It is also common to have different alerts and targets for daytime versus nighttime, or when exercising. For example, daytime alerts for low at 70mg/dL and high at 140mg/dL, night low 65mg/dL and high 175mg/dL (because sleep is important and as long as glucose is safe, level and not rising or dropping, fewer alerts makes for fewer nocturnal interruptions). When exercising, an individual may choose the low alert to be 100mg/dL so carbs can be consumed before the glucose levels actually get low, thus preventing interruption in exercise.
HbA1c
Hemoglobin is the molecule within red blood cells that carries oxygen to the body’s tissues. A small percentage of hemoglobin has glucose attached to it and this type of hemoglobin is known as hemoglobin A1c. The amount of hemoglobin A1c depends on the level of glucose in the blood: the higher the blood sugar the higher is the amount of hemoglobin A1c. This provides information about what average glucose level has been in the last 2-3 months. Prior to having CGM data, providers would use the HbA1c level as the main data consideration as to whether a person living with diabetes is doing well with glucose control, or not.
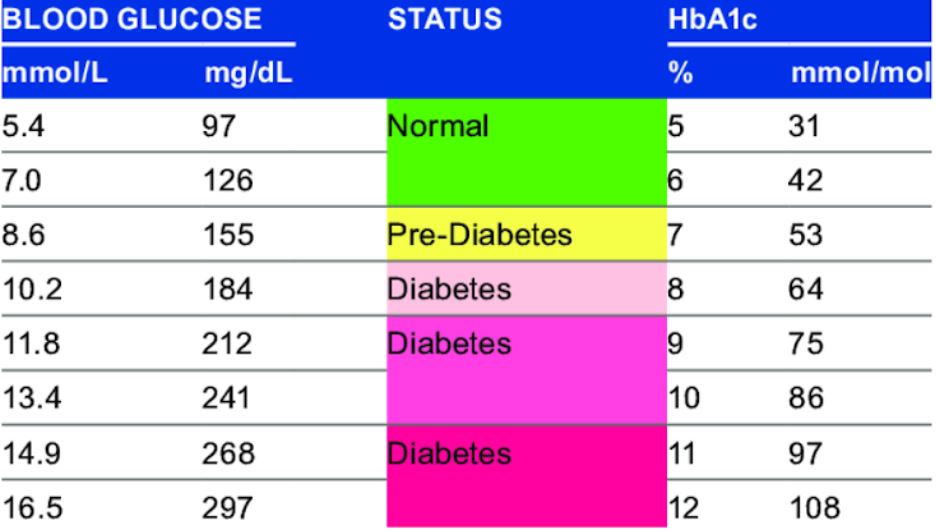
While HbA1c is a very important insight into glucose levels and should not be diminished, looking at this in isolation is limiting, and does not provide a full picture.
Time in Range
Time in range indicates the percentage of time, over a period of time, that glucose levels remained in a safe range. ADA guidelines suggest 70mg/dL – 180mg/dL for at least 16.5 hours of the day (approximately 70% of the day to be a minimum target for time in range. This CGM data point has become crucial for individuals to get a much more accurate picture of glucose management and control. It also is great insight for providers to determine whether insulin needs are being met and insulin is being utilized effectively and safely. For example, if a 5.8 HbA1c is achieved but glucose levels yo-yo from 50s-60s up into 250-300s every day and time in range is less than 60%, this is not ideal. Despite a “safe” A1C, glucose levels are fluctuating more than what is optimal for health, wellbeing and safety. Conversely, if an A1C is 6.9, but a person remains in range 88% of the time, this is a much safer and smoother outcome, leaving the individual feeling better also, with fewer wild swings in glucose levels.
Standard Deviation
Standard Deviation (SD) is a measure of the spread in glucose readings around the average, often referred to as the variation. For example, if someone has been fluctuating between many highs and/or many lows on a given day, they will have a larger SD. On the other hand, if someone is having a mostly stable day, they will have a lower SD. The goal is the lowest SD possible, which would reflect a steady glucose level with minimal swings (though keep in mind, even people who do not live with diabetes have glucose fluctuations throughout the day in glucose levels, especially after meals). The target is therefore not perfection, but minimal large swings, on average, over a spread of time (occasional dips and spikes still occur). Standard Deviation should be interpreted in conjunction with mean glucose, or a metric called coefficient of variation (CV).
CV is a fancy term for a simple calculation:
Divide the SD by the mean glucose and multiply by 100 to get a percentage. For example, if the SD is 40 mg/dL, and the average glucose is 130 mg/dl, then you divide 40 by 130, multiply by 100, and you get a CV of 30%. For reference, a person without diabetes will have a standard deviation of approximately 20%.
Generally, clinicians want people to have a CV of 33% or lower, which is considered a marker of “stable” glucose levels. This means aiming for an SD that is less than one third of the mean (or average) glucose. When interpreting SD in CGM data, it is often already a calculated CV percentage. CV and SD are key to getting more insight into a person’s glucose management.
Reasons that CV and SD are useful:
- Glycemic variability may be an independent risk factor for diabetes complications. It could be indicative of extreme levels on a regular basis, or prolonged periods of very high glucose levels.
- High glycemic variability makes you feel bad: the ups and downs from fluctuating glucose levels are exhausting, even if the average looks okay.
- SD/CV reflect variability in a single number, which can be more digestible than juggling many numbers. The larger the variability, the greater the risk of disabling hypoglycemia. The greater the spike, the larger the likelihood of extreme low glucose episodes.
Average Glucose
CGM data creates an average or mean glucose level based on all levels throughout a time period. While average glucose is a good indicator of overall glucose levels over a period of time, it does not show the entire picture. For this reason, providers look more closely and time in range, SD and CV, in conjunction with HbA1c and average glucose, to get a better understanding and full picture of glucose activity over a period of time.
While each of these variables provides insight into diabetes care and management, they are not tested with a “pass” or “fail” grade. It is crucial to adjust the mindset of how the data is interpreted. If ranges are not where you want them to be, and you see large swings in glucose levels on average, this is just an indication that the insulin use, amount and management needs to be adjusted under the guidance of your medical team. Safe ranges and optimal levels can be achieved without taking away from quality of life, thus leaving you feeling better, healthier and safer.